Data Integration: It’s a Lock
How Drones and Oriented Imagery can transform data into action.
Even seemingly simple construction projects can lead to massive amounts of data being produced. Knowing how to generate information from the data and communicate it to your intended audience makes all the difference. Take for instance the recent project undertaken by Environmental Science Services, Inc. (Es²) in which they repaired joints that had been identified by the US Army Corps of Engineers as leaking.
First steps on the site of the Algiers Lock, just south of the city of New Orleans where the intercoastal waterway and the Mississippi River meet, were to assess current conditions at the lock. ES2 accomplished this by:
- using a Wingtra drone to collect detailed photographic information about the site
- processing the data collected by the drone within the Pix4Dmatic software
- producing survey-quality data in the form of a GeoTIFF orthomosaic, GeoTIFF surface model, and a point cloud in .LAZ format
- publishing the data to ArcGIS Online where it could be seamlessly integrated with other GIS datasets
Flying nadir, with the camera facing directly beneath the drone, in an area with a large number of vertical edges in close proximity to water (namely, along this lock) and processing the imagery to produce an orthomosaic introduced artifacts along the vertical edges. This was expected behavior. For future projects, Es² intends to consider oblique imagery capture in order to provide additional imagery products.
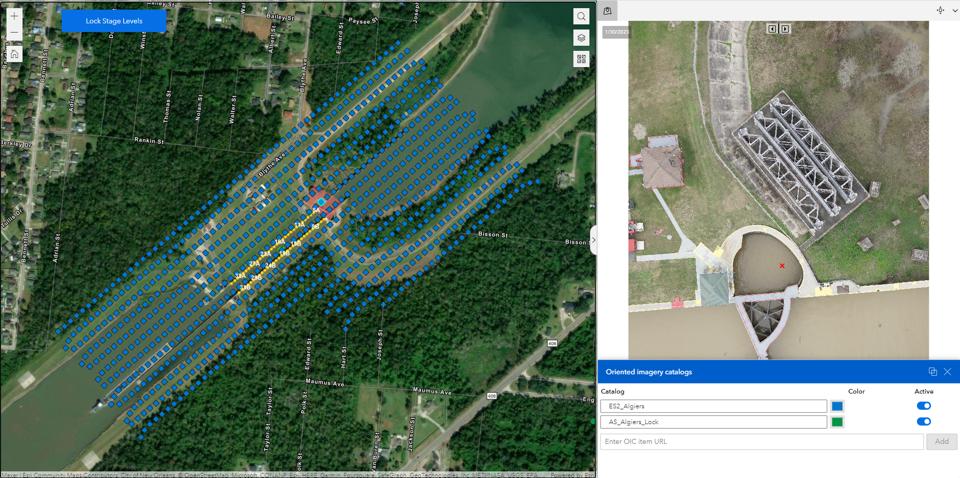
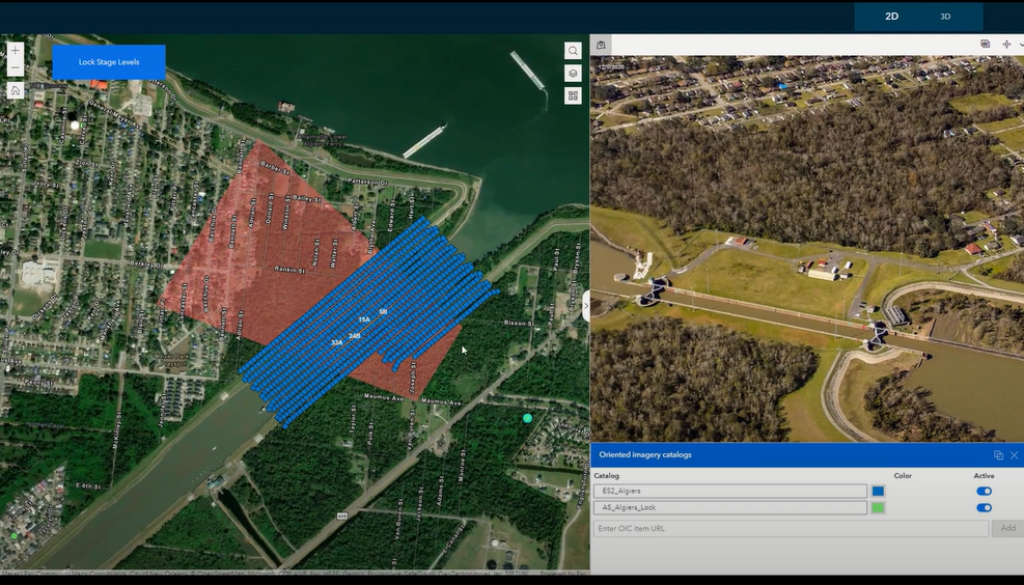
One important step along the way in this data production was the use of the Manage Oriented Imagery Toolbox for ArcGIS Pro add-on to produce an oriented imagery catalog of the individual raw images collected by the Wingtra drone, which was then also published to ArcGIS Online.
With the current conditions inventoried, the process of sealing each of the leaking joints throughout the lock commenced, and communicating that progress involved updating data points for each joint with a status, which was then reflected in an ArcGIS Dashboard created using Experience Builder.
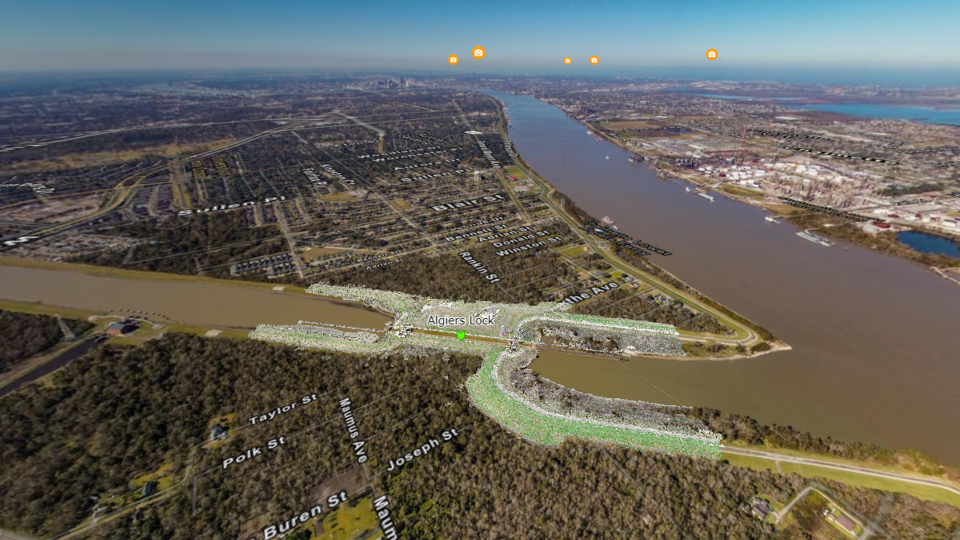
AerialSphere took the project to the next level with the development of an Experience Builder application that integrated all of the data that Es² staff developed, and made it available for viewing and analyzing in an enhanced way. Staff could navigate the lock study area, with the integration of 360 degree aerial imagery from AerialSphere providing an immersive, regional view of the project. Further navigation within the application enabled them to see the drone GeoTIFF orthomosaic and point cloud data collected by Es² overlain on data available from within the ESRI Living Atlas. But perhaps most important of all was the use of the oriented imagery catalog of the raw images collected via the Wingtra drone – this allowed Es² staff to easily drill down into the data and access the original image in its proper spatial orientation, while still being able to see this image location in its larger context of the project.
While this solution was developed for a specific project in southern Louisiana, this technology can be implemented for a number of other circumstances including:
- Strategic asset management
- Security and resiliency
- Sustainability
- Performance measurement
